
Metabolic Health Anaysis:
based on the
Metabolic Syndrome
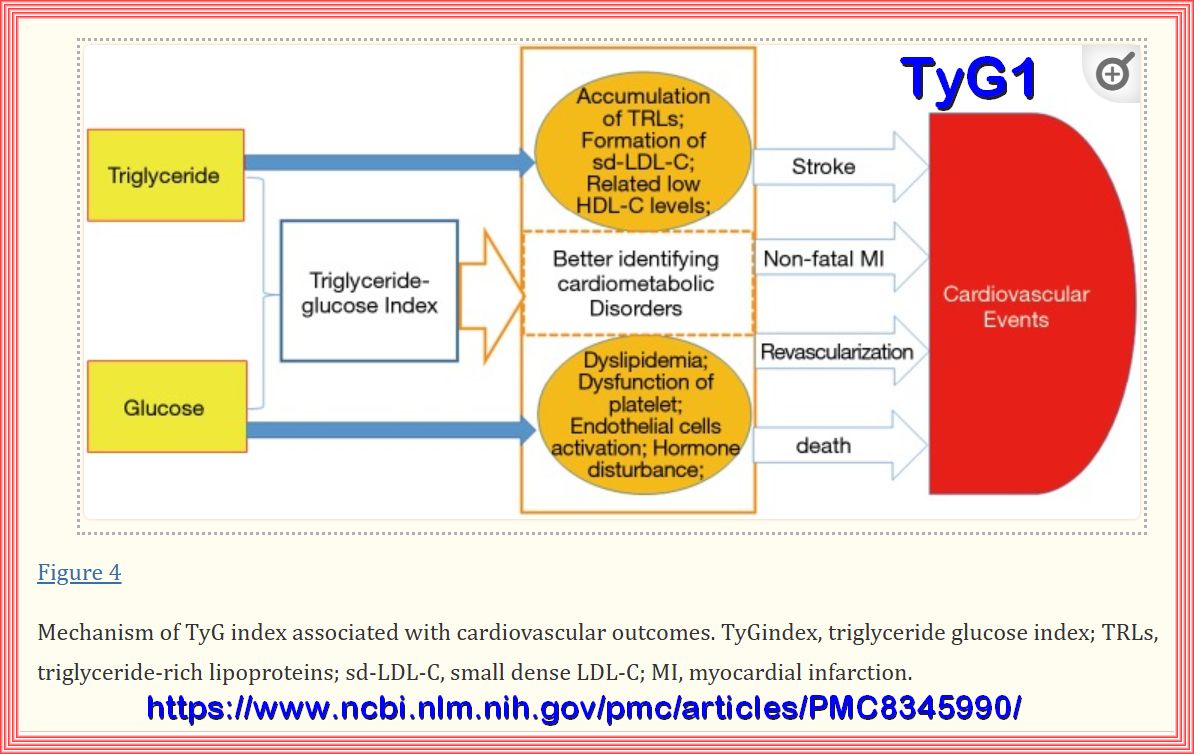
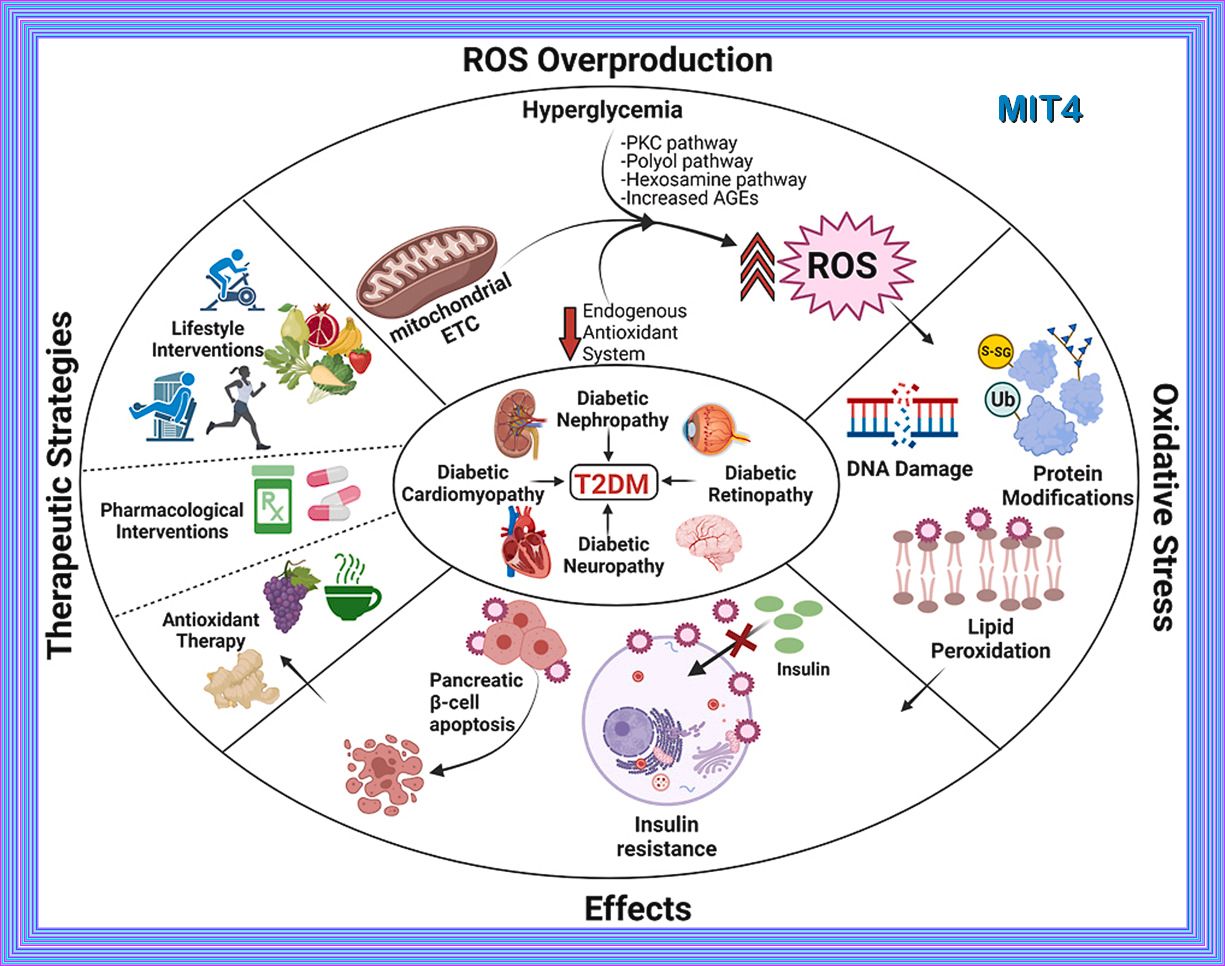
The TyG index is significantly associated
with future cardiovascular mortality, myocardial infarction, stroke, and type 2 diabetes, suggesting that
insulin resistance plays a key role in the pathogenesis of cardiovascular and metabolic diseases. This index is
suitable for daily clinical practice as it is easy to measure and calculate from routinely available laboratory
measures. Hence, the TyG index might help in the early identification of people at high risk of developing
cardiovascular events or type 2 diabetes.
It has been documented that the TyG index was the best
index to identify individuals with insulin resistance, even
superior to visceral adiposity indicators and other lipid
parameters. Hence, the TyG index has been proposed as
a simple and reliable clinical surrogate marker of insulin
resistance.
Association of the triglyceride glucose index as a measure of insulin resistance
The TyG index was calculated as Ln ((fasting triglycerides [mg/dL] X fasting plasma glucose [mg/dL])/2).
Your TyG INDEX IS :
Quartile reference from the JLA
| QUARTILES | MEN | WOMEN |
|---|---|---|
| Quartile 1 (Q1): | ≤ 8.13 | ≤ 7.71 |
| Quartile 2 (Q2): | 8.14 - 8.54 | 7.86 - 7.99 |
| Quartile 3 (Q3): | 8.55 - 8.98 | 8.00 - 8.33 |
| Quartile 4 (Q4): | ≥ 8.99 | ≥ 8.34 |
The results of several studies showed that the optimal cutoff point of the TG/HDL-C ratio for the prediction of
hyperinsulinemia/Metabolic syndrome was approamatly 2.4 - 3.0 for non-Hispanic whites and Mexican Americans and 2.0 for non-Hispanic blacks.
The TyG index can be also used as a feasible, efficient, routine, immediately obtainable, and inexpensive biomarker for an
Index of Intracranial Atherosclerosis in Nonstroke Individuals.
| The higher the ratio, the higher the risk. |
| A ratio below 3.5:1 is considered very good. |
| Most healthcare providers want the ratio to be below 5:1. |
Your TG/HDL INDEX IS :
The lipid accumulation product (LAP) is a simple and accurate index for predicting metabolic syndrome, type 2 diabetes, and non-alcoholic fatty liver disease (NAFLD)
LAP INDEX IS :
For men:
| 95th percentile: 144.7 cm-mmol/L |
| 90th percentile: 112.0 cm-mmol/L |
| 75th percentile: 66.1 cm-mmol/L |
| 50th percentile: 37.4 cm-mmol/L |
| 25th percentile: 19.1 cm-mmol/L |
For women:
| 95th percentile: 135.6 cm-mmol/L |
| 90th percentile: 103.5 cm-mmol/L |
| 75th percentile: 60.4 cm-mmol/L |
| 50th percentile: 30.3 cm-mmol/L |
| 25th percentile: 15.6 cm-mmol/L |
The Visceral Adiposity Index (VAI) is a sex-specific mathematical index that indirectly expresses visceral adipose function and insulin sensitivity. It’s based on several factors: Waist Circumference (WC), Body Mass Index (BMI), triglycerides (TG), and HDL cholesterol (HDL) levels. The VAI helps identify visceral adipose dysfunction (VAD) associated with cardiometabolic risk.
Your VAI Result is :
These thresholds can help identify individuals at risk.
| Age ≥ 30 years: VAI cut-off = 2.52 |
| Age ≥ 30 and < 42 years: VAI cut-off = 2.23 |
| Age ≥ 42 and < 52 years: VAI cut-off = 1.92 |
| Age ≥ 52 and < 66 years: VAI cut-off = 1.93 |
| Age ≥ 66 years: VAI cut-off = 2.00 |
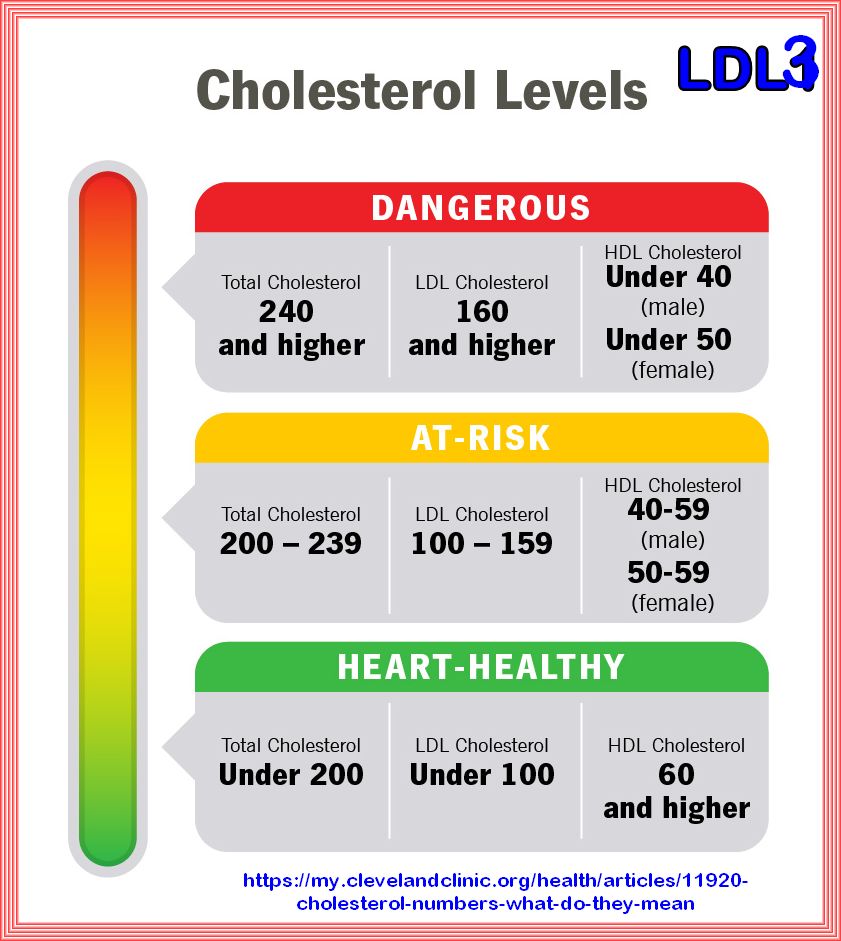
LDL TO HDL RATIO: The total cholesterol to HDL cholesterol ratio is way to calculate cardiovascular risk. A high total cholesterol to HDL ratio indicates a higher risk for heart disease. It can be measured by dividing the total cholesterol by the HDL level.
| Ideal: below 2.0 |
| Good: below 5.0 |
| Too high: above 5.0 |
The lower this number is, the healthier a person’s cholesterol levels are.
Your TOTAL LDL/HDL RATIO IS :
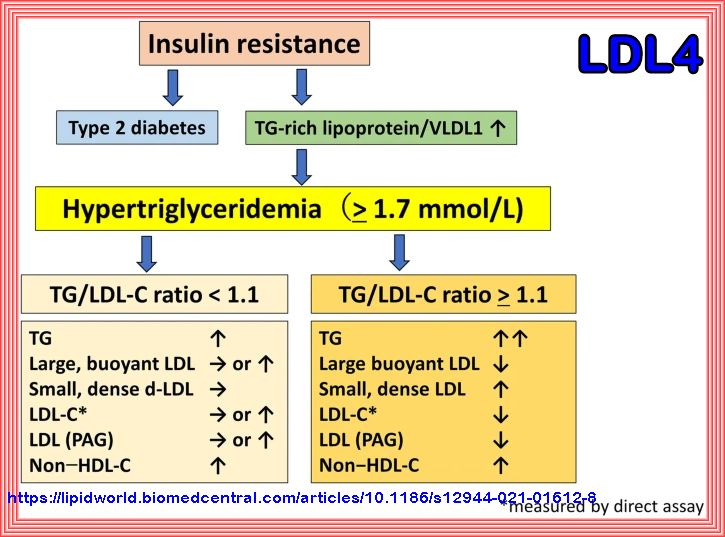
Triglyceride/Low-Density-Lipoprotein Cholesterol (LDL) ratio is the most valuable
predictor for increased small, dense LDL in type 2 diabetes patients.
The TG/LDL-C ratio is a reliable surrogate lipid marker of sd-LDL and superior to non–HDL-C in type 2 diabetes patients not treated with statins.
LDL is computed by plugging the measurements for total cholesterol, HDL, and triglycerides into a: LDL = (Total cholesterol- ( HDL – (Triglycerides / 5))).
LDL can also be measured directly in a non-fasting blood sample.
Your triglyceride/LDL-C RATIO IS :
Continuous metabolic syndrome score (siMS) enables quantification of severity of cardiometabolic affliction in individuals not presenting with metabolic syndrome The SIMS Index is a simple and effective biomarker for identifying individuals at risk of developing metabolic syndrome and non-alcoholic fatty liver disease (NAFLD).
Your SIMS SCORE IS :
| Quartile 1 (Q1): 0.65 - 1.72 |
| Quartile 2 (Q2): 1.721 - 1.98 |
| Quartile 3 (Q3): 1.981 - 2.23 |
| Quartile 4 (Q4): 2.231 - 2.62 |
| Quartile 5 (Q5): 2.621 - 7.08 |
Calculation of siMS might help to estimate the severity of cardiometabolic affliction in so called “low-risk” subjects, e.g. individuals, who do not present with METABOLIC SYNDROME components yet. Proportion of these individuals is not negligible, and they logically escape the attention of the physician, and thus the opportunity of being early motivated to implement changes in lifestyle, which could slow-down or even interrupt pathological processes.
AST, ALT, and their ratio help us screen for liver diseases and detect possible liver damage.
A. AST and ALT might be elevated during a heart attack, infections, inflammations, and while taking certain drugs.
B. AST/ALT ratio helps us differentiate between alcoholic and non-alcoholic hepatitis (liver inflammation).
C. A ratio of AST ALT greater than 1 can be indicative of cirrhosis - a scar tissue transformation of the liver that eventually results in a loss of its function.
D. AST ALT ratio > 2 strongly suggests alcoholic hepatitis - an inflammation caused by the consumption of too many units of alcohol for a regular period of time.
Refer to AST Alt Ratio Calculator
Your AST/ALT RATIO IS :
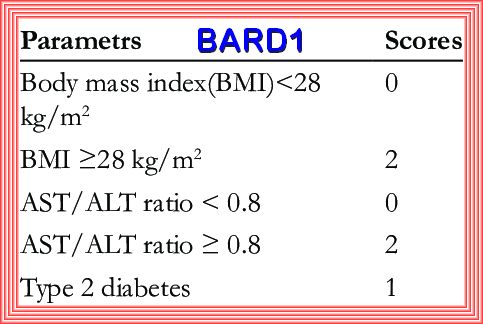
The Bard Score is a simple and accurate index for predicting metabolic syndrome, type 2 diabetes,
and non-alcoholic fatty liver disease (NAFLD)
BARD and NAFLD fibrosis scores have high NPV values, are capable of excluding advanced liver fibrosis and markedly reducing
the incidence of liver biopsies in patients with NAFLD. This invasive procedure is required only in a certain group of patients.
Obesity, diabetes mellitus, more advanced age, platelet count ≤200×109/L, and AST/ALT ratio = 0.8 or higher are considered the risk
factors of advanced fibrosis in patients with NAFLD.
BARD scores equaling 0 or 1 are of high (96%) negative predictive value (NPV) for advanced fibrosis
Your BARD SCORE IS :
The FIB-4 calculator is a simple tool for assessing the probability of NAFLD liver fibrosis.
The FIB-4 score is a powerful instrument for ruling out or confirming a diagnosis of advanced fibrosis. It
's most efficient in adults aged 35-65.
FIB-4 > 3.25 - should confirm the presence of advanced fibrosis
FIB-4 < 1.45 - should exclude the presence of advanced fibrosis (F3-F4) in 94.7% of patients. (read more in article by Vallet-Pichard et al.)
FIB-4 INDEX
FIB-4 = (AGE X AST) / ( platelet count X √ALT).
Your FIB4 SCORE IS :
HbA1c what it tell us and why it is important
The HbA1c is an accurate and easy-to-administer test with on-the-spot results availability and can be an effective tool in establishing the diagnosis of diabetes, especially in low- and middle-income countries and hard-to-reach populations. Even though HbA1c has been endorsed for diagnosis of diabetes, in most of the countries worldwide, some testing strategies and cutoff ranges are still being debated. However, combination of Fasting Glucose test and HbA1c significantly enhances the diagnostic accuracy of these individual tests. The prognostic potential of HbA1c lies in its unique ability of assessing retrospective glycemic control as well as predicting the lipid profile in diabetic patients. As the epidemic of diabetes continues to grow worldwide, HbA1c test may continue to be implemented as part of the diagnostic and prognostic tool, leading to better patient care and successful clinical outcomes.
| HbA1c provides valuable insights into glycation and its impact on endothelial dysfunction. Higher HbA1c levels are associated with increased AGE formation and accumulation, which can contribute to endothelial dysfunction and vascular complications. Intensive glycemic control can help reduce the risk of these complications. |
| Your average blood glucose (sugar) levels for the last two to three months |
| If you have diabetes, an ideal HbA1c level is 48mmol/mol (6.5%) or below |
| If you’re at risk of developing type 2 diabetes, your target HbA1c level should be below 42mmol/mol (6%) |
| The result of the HbA1c test lets your healthcare team know if they need to change your treatment or medication to help you manage your levels better |
| The amount of glucose in your blood that has attached to your hemoglobin over the past 2-3 months |
| Your blood glucose control over the past 2-3 months |
| Your risk of developing serious complications in your body, such as high blood pressure, kidney disease, and nerve damage |
| The effectiveness of your treatment plan and medication in controlling your blood glucose levels |
| The need for changes to your treatment plan or medication to better manage your blood glucose levels |
| The amount of glucose in your blood that has attached to your hemoglobin over the past 2 to 3 months |